
Layer on the Data
By mining National Assessment of Educational Progress (NAEP) data from students’ responses to two questions, we discover a mother lode of information about the importance of books in a home and self-determined habits of reading.
We examined 8th graders’ responses to “How many books do you have in your home?” and “How often do you read for fun?” We plotted data sets for each state and discovered hidden patterns that can help community stakeholders see powerful connections between books in the home, habits of reading, and reading proficiency.
Now, let’s add a few more layers of data to further test our theory that access to relevant books combined with a daily habit of shared book reading can lead to big changes in grade-level reading.

Let’s look for patterns and relationships for students from three demographic subgroups that historically have lower test scores: students whose parents didn’t complete high school, ethnic groups other than white, and students who qualify for free and reduced lunch.
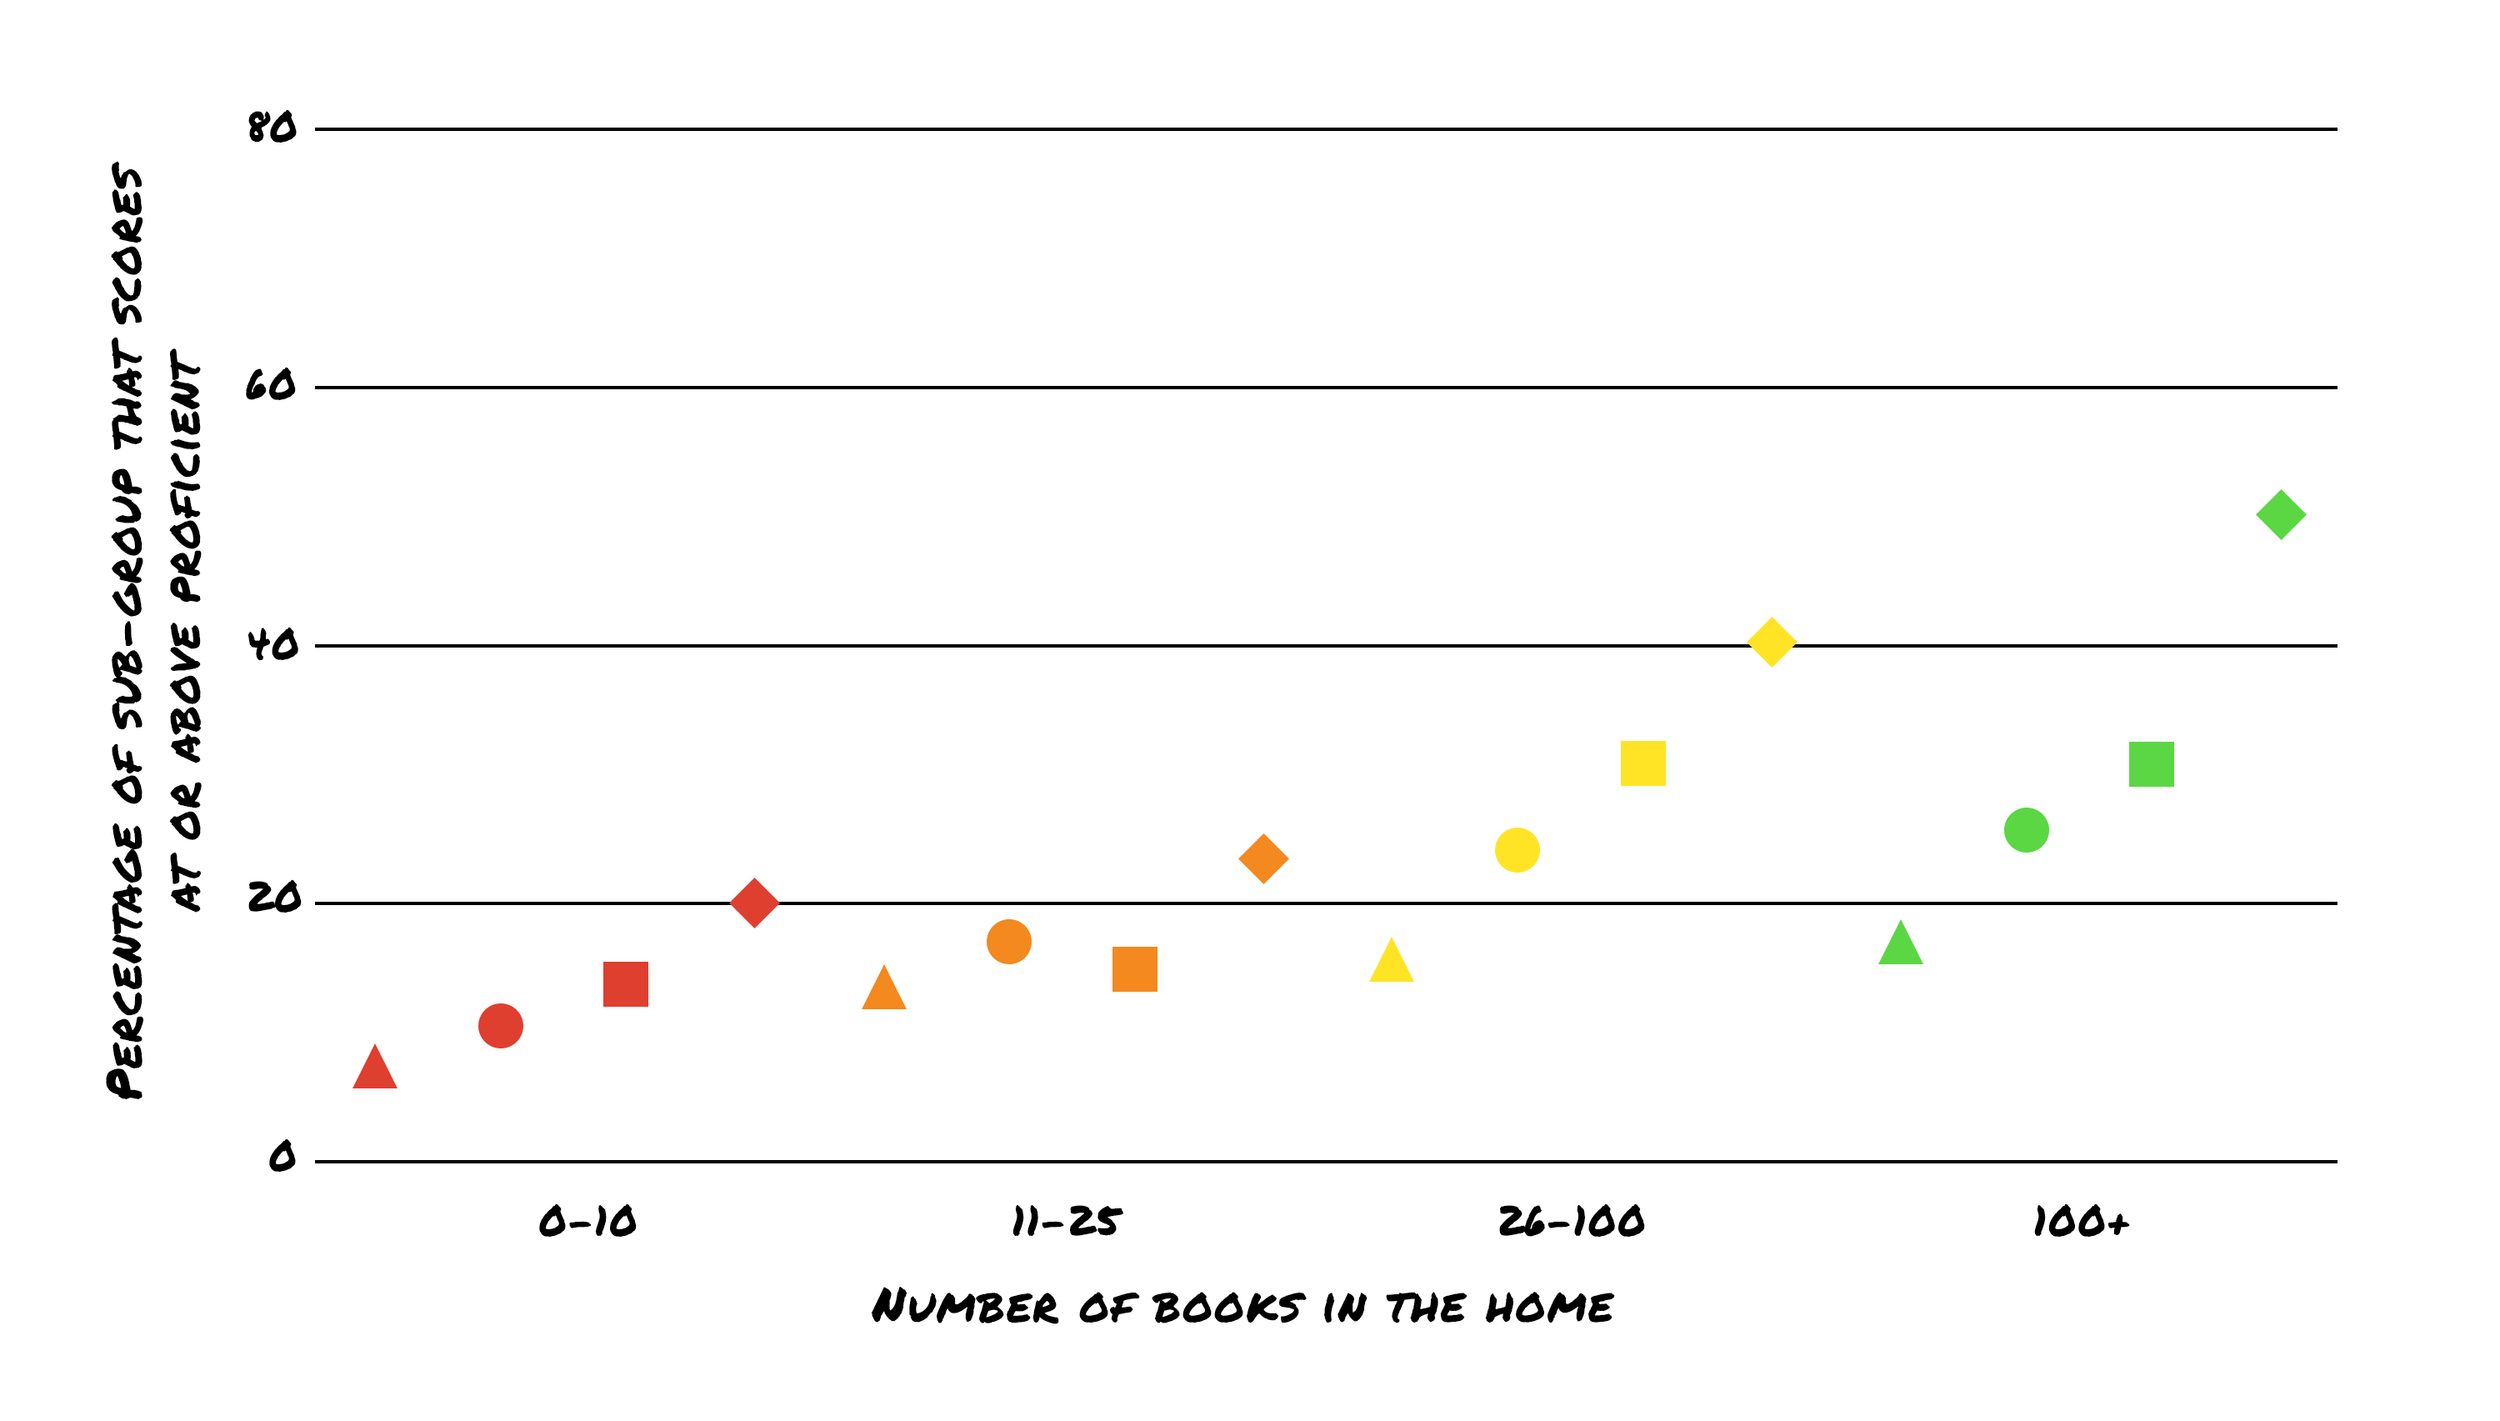
Note that the four colors indicate how many books students say their homes have. Red indicates 0-10 books. Orange is 11-25. Yellow is 26-100. Green is 100+. The shapes represent how often students say they choose to read. Triangles represent never; circles, monthly; squares, weekly; and diamonds, daily.
Graduation gap
When we look at the subgroup of children whose parents did not graduate from high school, we can see a slight shift down in the proficiency scores. This validates a noticeable gap. But more importantly, we see a matching pattern from left to right.

Ethnicity
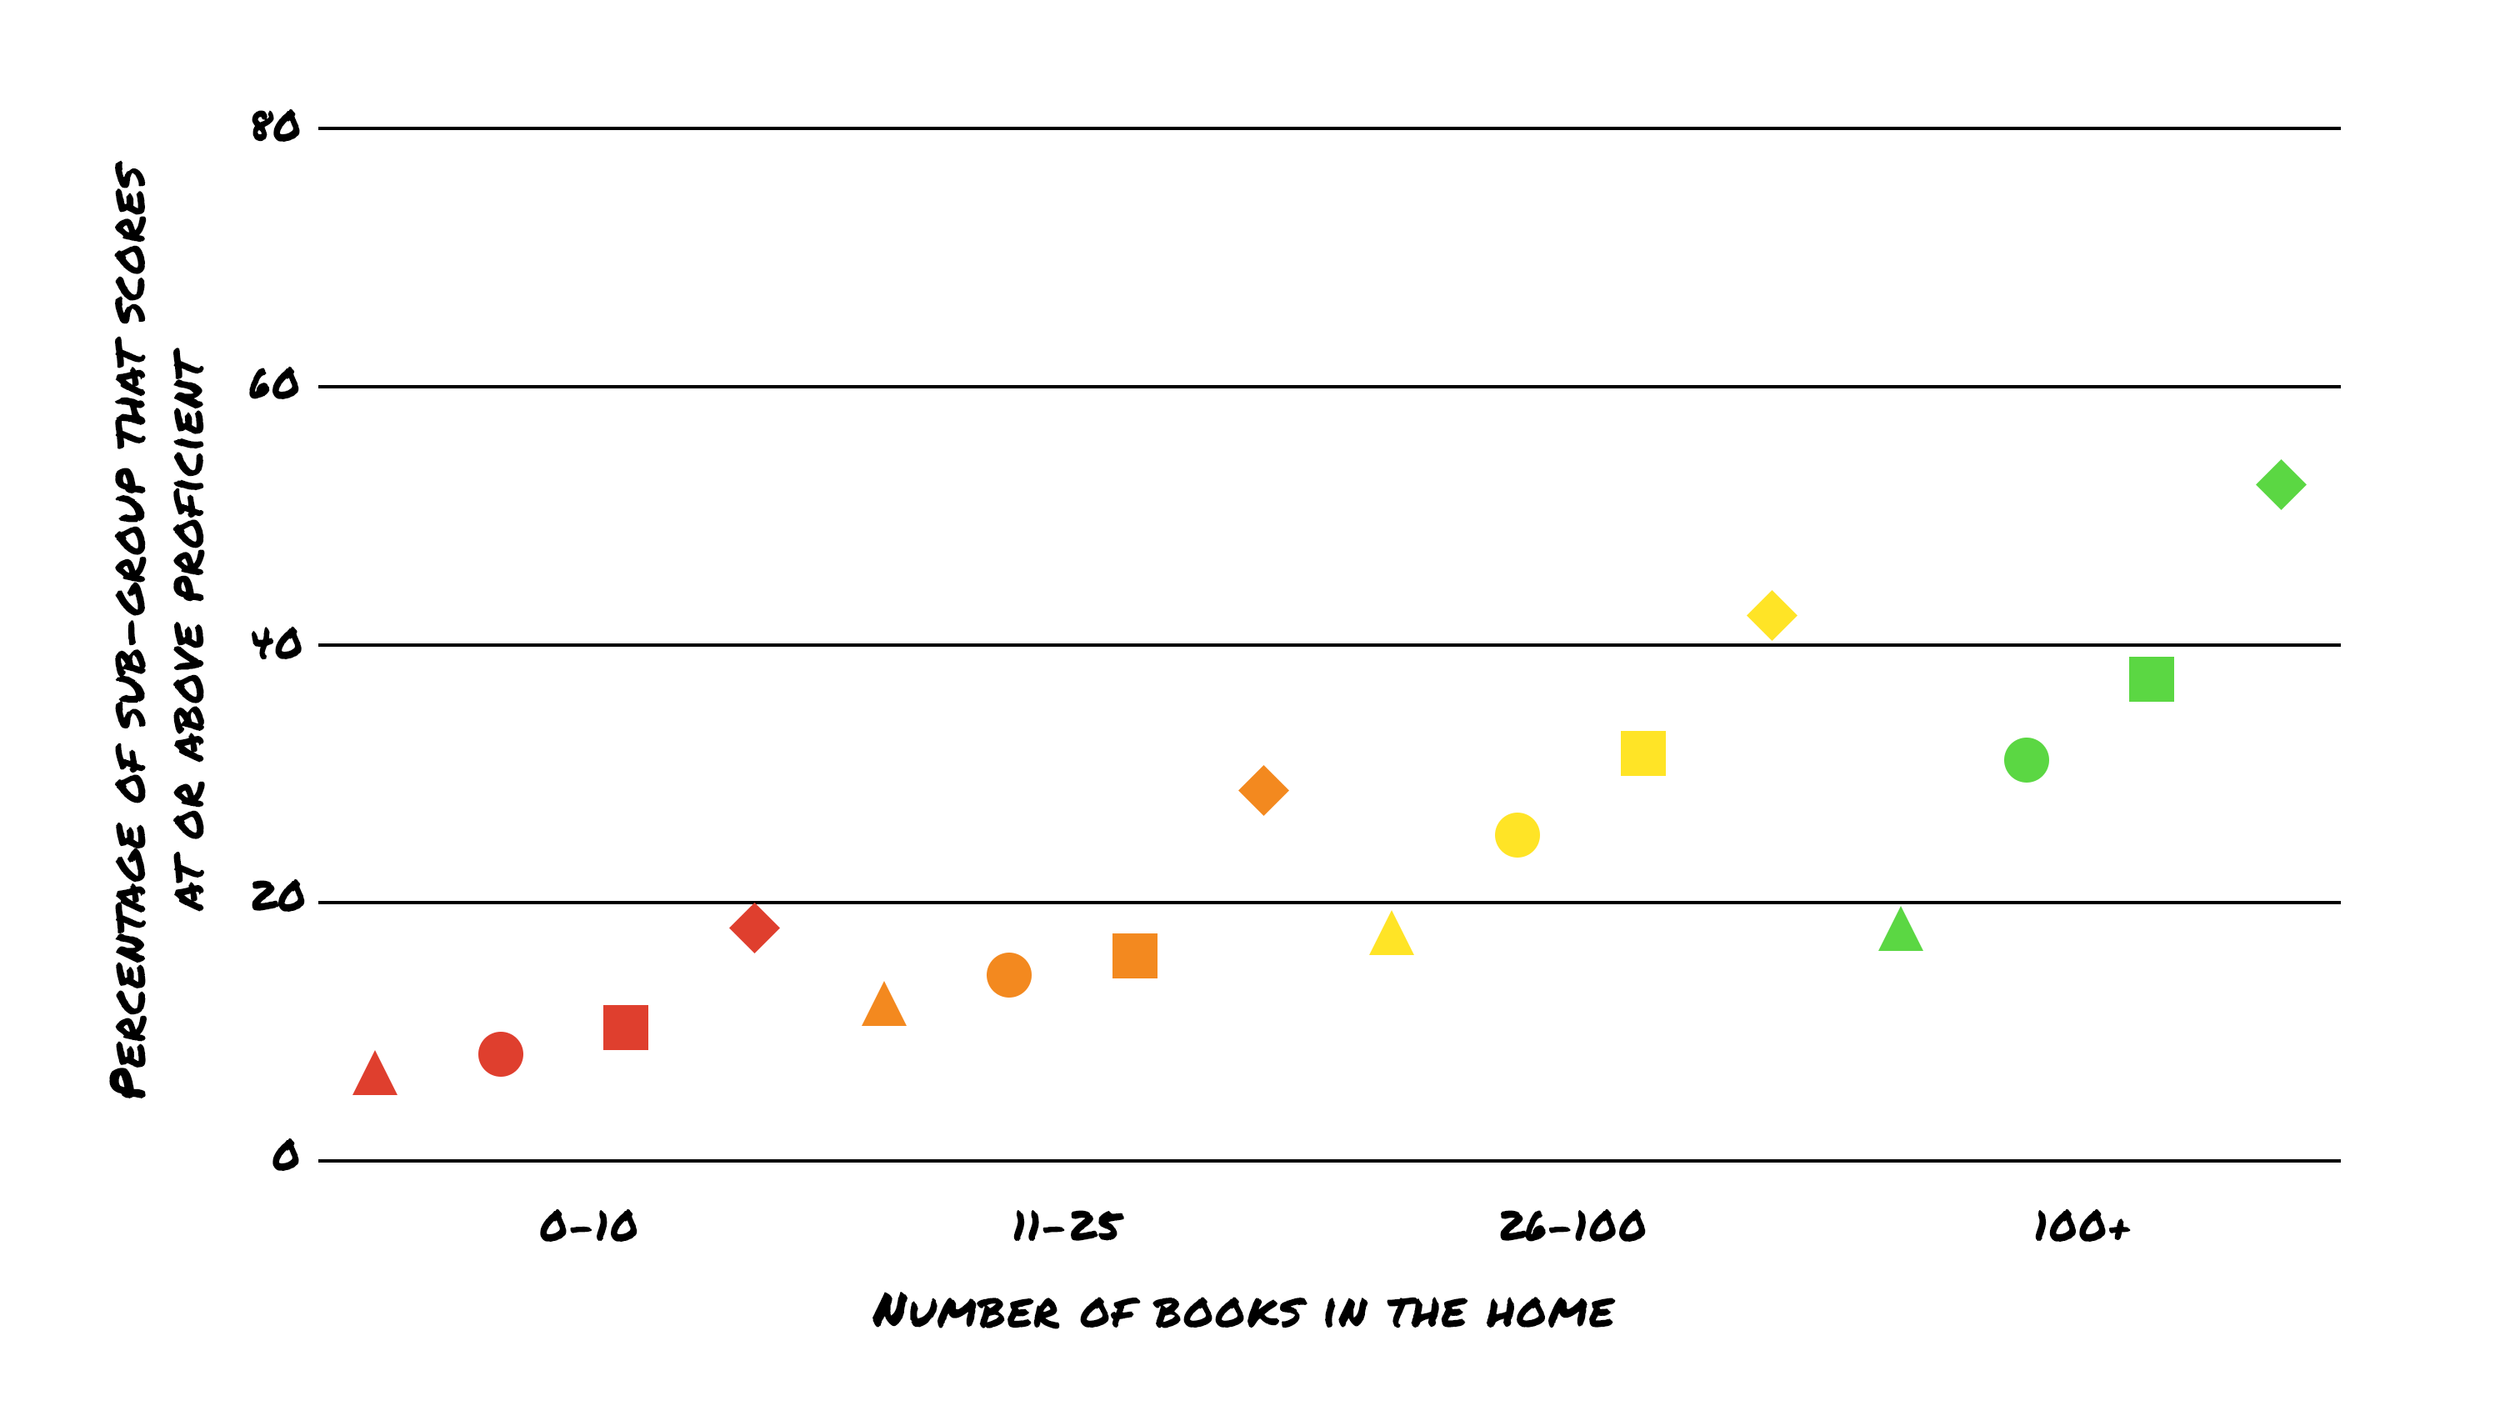
When we account for ethnicity, the hidden pattern we discovered is repeated. Seeing the pattern repeat increases the validity of the story the data tells us.
Free lunch
When we study the results for children who qualify for free and reduced lunch, which essentially is a proxy for households with a very low income, once again, the pattern is exactly the same. These are the children most often cited as the group with the most significant reading gap.
Over time, when we compare students from one or more of these demographic groups to the average of all students, we see that those affected by structural inequalities, yet have 100 books in the home and read every day, way outperform the national average.
The take away
Students on the right side of each demographic subgroup—the students who have many books in their homes, especially 100 or more books and who choose to read—consistently outscore their peers on reading proficiency assessments.